 By
By
Summary of this week's the solution tea ☕
- Discuss what occurred in sprint 2 of the PLG experiment
- Identifying the challenges faced while using analytics tools such as Google Analytics, HubSpot, LinkedIn, and Meta Business Suite
- Narrow and Focus: updates to experiment scope
- Results and observations from Solution Wolfe’s product-led growth experiment to this point
In the last post, we discussed that when it comes to product-led growth, things don’t always go as planned. To catch you up, Solution Wolfe is being experimented on to using product-led growth techniques to create content while leveraging Google Analytics, Hubspot, LinkedIn, and Meta Business Suite to verify if what we are doing is working. We left off on a tactical bet to get readers closer to value upon entry to the Solution Wolfe website (read more about here)
Your AI won't be capable of generating clickbait unless you are obsessed with your customer's journey, and know how to effectively apply it.
During Sprint 2 of our experiment, I took a rather vulnerable step to enhance customer-centricity in the journey of sharing The Solution Tea blog post on social media. My aim was to demonstrate the value of my content to readers at an earlier stage in their journey before they even reach the https://solutionwolfe.com site. To achieve this, I shared the same post in two different ways, with a two-day gap between them. While the first post was not necessarily bad, but it failed to provide enough information for readers to commit 8-10 minutes of their valuable time to read it, especially if they were unfamiliar with me.

It's important to note that 8-10 minutes is a significant commitment for busy professionals without providing what's in it for them. The result? Poor engagement with both the LinkedIn post and with The Solution Tea blog post. Not unexpected. Without providing additional information about the content, readers were unlikely to engage further, especially those unfamiliar with me.
I shared the same blog three days later in a second post, but this time included more value in the form of a summary of the blog post provided during the share.

Engagement time with The Solution Tea blog post shared improved, showing that readers likely consumed the entire post. If we continue to see engagement, this will be indicative that the content actually is valuable. Creating a purposeful journey for your audience is crucial for enhancing customer centricity. And the right metrics can help prove the obtained value, ensuring that your content truly resonates with your readers.
Lesson Learned in Sprint 2: Although I wanted to share all the important details, it may not have been the wisest decision to include everything in a single post. Moving forward, a more effective approach would be to create multiple posts when the content is extensive and reference them in each other's posts. This way, we can deliver valuable content more efficiently.
Narrow and Focus: updates to experiment scope
The commitment in this experiment was to leverage Hubspot, Google Analytics, LinkedIn and Meta Business Suite to validate the OKRs we aim to achieve through these experiments. However, onboarding all the analytics tools all at once has proven to be a daunting task. For the first OKR (4 sprints) the focus will be on leveraging Hubspot for Analytics. While the focus will be on Google Analytics, the next focus will be on Hubspot then LinkedIn, then Meta Business Suite. Have you seen Meta Business Suite? It's going to require some heavy lifting and more capacity than I can realistically commit to. This is an example of what happens all the time in the process of creating value. Sometimes the vision is bigger than what can be realistically accomplished in the timebox we have and that means we need to still provide value but address the scope.
OKR Check-in
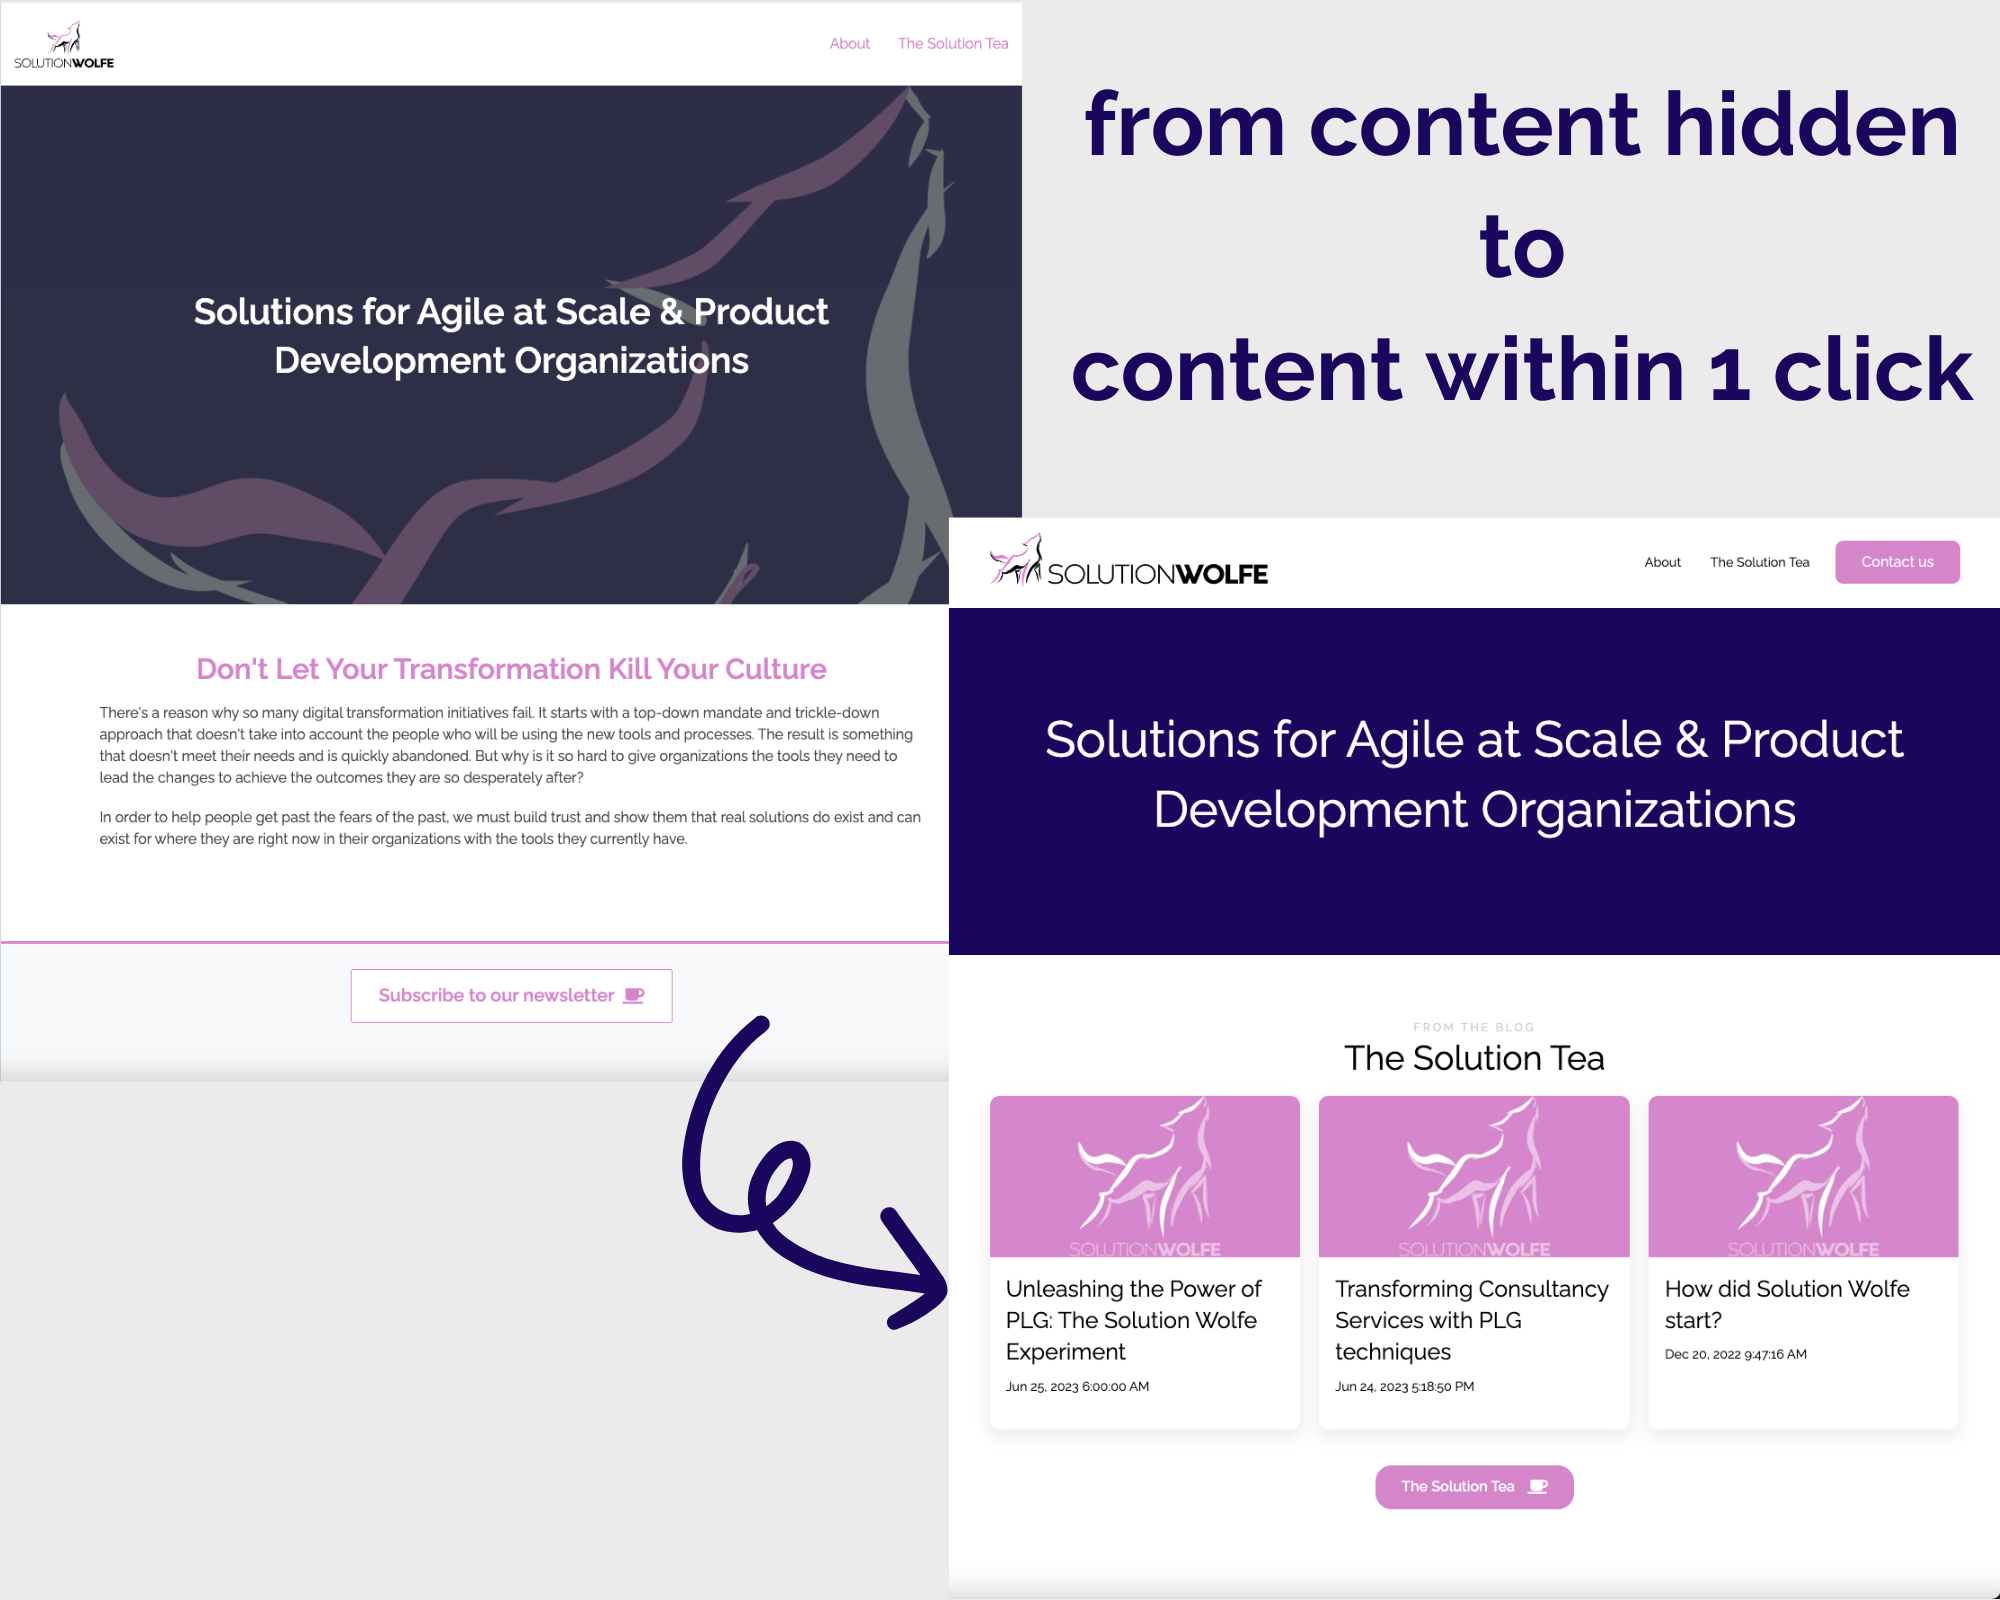
In effort to share my experiences, I must handle the technical debt to maximize the flow of value on the site- Objective 1: Minimize Friction from the Experience
- ✅ Key Result 1: No more than 1 click to get to top content from home page
- Key Result 2: Content traffic will increase by 50% one month after new UI launched
📉 User activity over time
Metric Baseline (6/25) UI Updated (6/28) Mid Experiment Check-in (7/8) 30 days 31 45 65 7 days 26 40 14 1 day 15 8 1 
- ✅ Key Result 1: No more than 1 click to get to top content from home page
-
- Objective 2: Drive engagement - Content drives action
- Key Result 1: LinkedIn Engagement around Solution Wolfe content increase by 25% after 1 month of the experiment
Pivot for the time being, but come back to this metric very soon. In the meantime, see a comparison of the LinkedIn Analytics from the posts shared in sprint 2
- Post 1 Analytics

- Post 2 Analytics

- Post 1 Analytics
- Key Result 1: LinkedIn Engagement around Solution Wolfe content increase by 25% after 1 month of the experiment
- Objective 2: Drive engagement - Content drives action
-
-
- Key Result 2: Website content engagement increase by 50%
📉 Average Engagement Time
Baseline (6/25) UI Updated (6/28) Sprint 1 Retro Post (7/4)
First PostSprint 1 Retro Post (7/6)
Second Post1 min 15 sec 57 sec 2 min 42 sec 8 min 18 sec 
- Key Result 2: Website content engagement increase by 50%
-